In this post, I introduce a new conceptual framework for automatic letterfitting, i.e. the fully computerized spacing and kerning of typefaces. The goal is to be able to reproduce, to a good degree of fidelity, the horizontal metrics of existing well-fitted typefaces using only a few parameters – and, once we are successful, to use similar parameters to infer spacing and kerning values for new typefaces based purely on their glyph shapes.
Behind this whole project is an intuitive motivation: to make letterfitting tractable, we need to find a way to make any two glyph pairs comparable, in an apples-to-apples sense, regardless of what the glyphs look like. How can we do that?
This is a long post, so feel fee to skip around to look at pictures. I intend to
- explain how the stages of the proposed framework fit together,
- suggest some specific implementations for each stage in the diagram below, providing evidence for their physiological plausability when possible,
- tell you how I’ve arrived at this framework in the first place,
- talk a little about the results so far.
On a personal note, letterfitting has for almost a decade been my go-to object of meditation, one of the things my mind instinctively wanders to when I take too long of a shower in the morning. Given how trivial it appears, a simple solution is maddeningly elusive.
This is nowhere near done, but since I have no time in the foreseeable future to finish this, I wanted to publish what I have so far. I hope that I can inspire some others to join me on this quest.
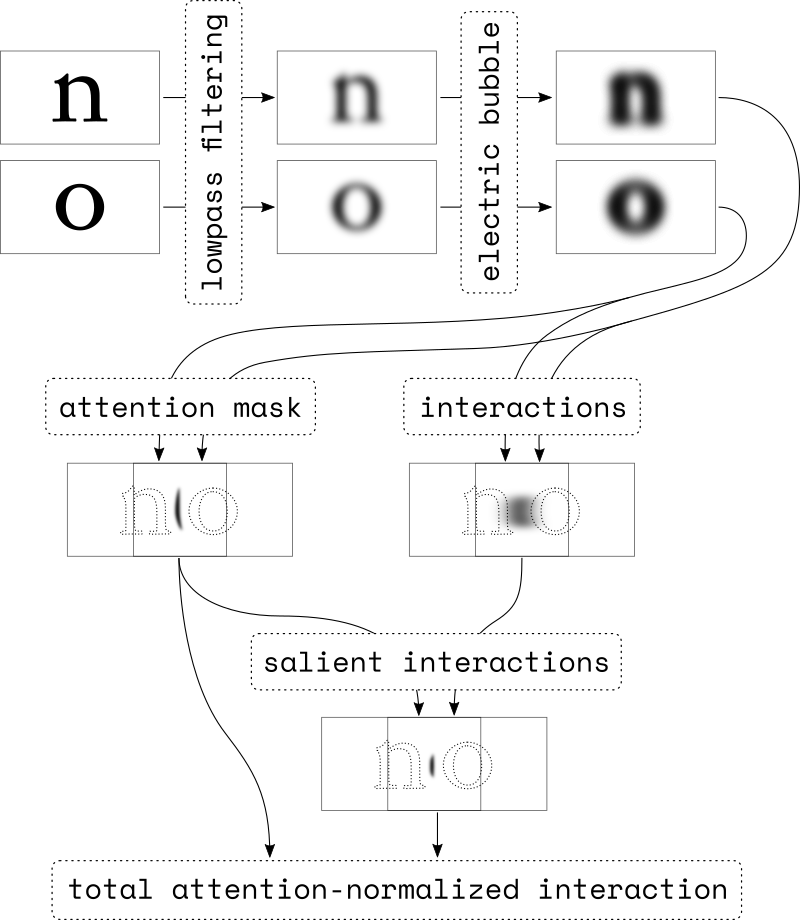
At the heart of the proposed framework (and I call it a framework because, as you will see, it is a collection of ideas instead of a strictly prescriptive model) lies a particular conjecture about how we perceive the separation between any two glyphs. Here it is: the visually perceived separation – and, consequently, the decision whether the glyphs are too close or too far apart – is determined entirely by the glyphs’ interactions within a particular area of attention. In other words: a human designer fitting glyphs by hand will not look at the shapes as a whole, but instead focus her scrutiny on a fuzzy, invisible sliver of negative space located roughly half-way between them.
Crucially, while the strength of the glyphs’ interactions decays with their distance, the area of attention remains relatively stable, as it a function primarily of the glyphs’ shape and size. The ratio of the two numbers, therefore, is comparable across glyph pairs, no matter whether we are looking at two capitals or two pieces of punctuation. We can therefore fit the whole typeface by simply equalizing this attention-normalized interaction strength across all glyph pairs.
Now – how do we find the area of attention and the strength of interaction? That’s what this post is about.
A word on spacing and kerning
Before we get into the nitty-gritty details, I want to get an important question out of the way. Does this model auto-space or auto-kern? Or both? And what is letterfitting, anyway? Answer: this model does both at once. It has to, because it is an algorithm that accepts two shapes (the glyphs) and returns a single number (their distance, in pixels, at which their normalized interaction equals some value). The algorithm cannot know how this distance value should break down into spacing and kerning values, because it lacks the context of the rest of the typeface.
We will therefore find the ideal distance for each glyph pair first – yes, there’s a lot of them, but that’s why we’re using a computer – and then use linear or quadratic programming techniques (depending on whether you prefer fewer kerns or smaller kerns) to digest the list of pairwise distances into mathematically optimal side bearings and kerns.
Unfortunately, and please excuse the following rant, many typographers have misconceptions about spacing and kerning, leading to weird cargo-culting around the “space first, kern later” mantra. The confusion is understandable, because many popular letterfitting methods produce only side bearings, and require the user to then add kerns to rectify any shortcomings. This reinforces the erroneous notion that kerns are an unsavoury trick to “fix” overlapping or otherwise idiosyncratic glyph pairs.
Instead, it is more accurate to think of the break-up of pair distances into side bearings and kerns as a simple compression trick: by maximizing the entropy in the side bearings, we can save on labour (because good side bearings are enough for most pairs) and file size (because many kerns will be zero). In the absence of a convex constraint solver – which should be a basic feature of every 21st-century font editor but somehow isn’t – “space first, kern later” just happens to be a reasonably effective heuristic for arriving at a decent compression by hand. The existence of auto-spacing tools proves nothing, except that parsimony in prescriptive models comes at a price. Anyone selling you “auto-kerning” tools is a quack.
To eliminate misunderstandings, I will substitute the generic term “letterfitting” for “finding pair distances which can later be compressed into optimal spacing and kerning tables”.
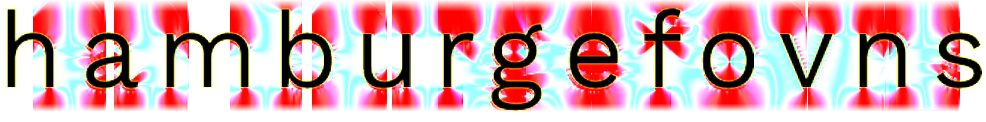
Preprocessing: lowpass filtering for scale
Before we can estimate areas of attention and interaction, it is a good idea to consider at what size our typeface will be read, because the size (in letters per degree of the reader’s field of view) will determine which parts of a glyph contribute most to the perceived interaction with the glyph’s neighbours.
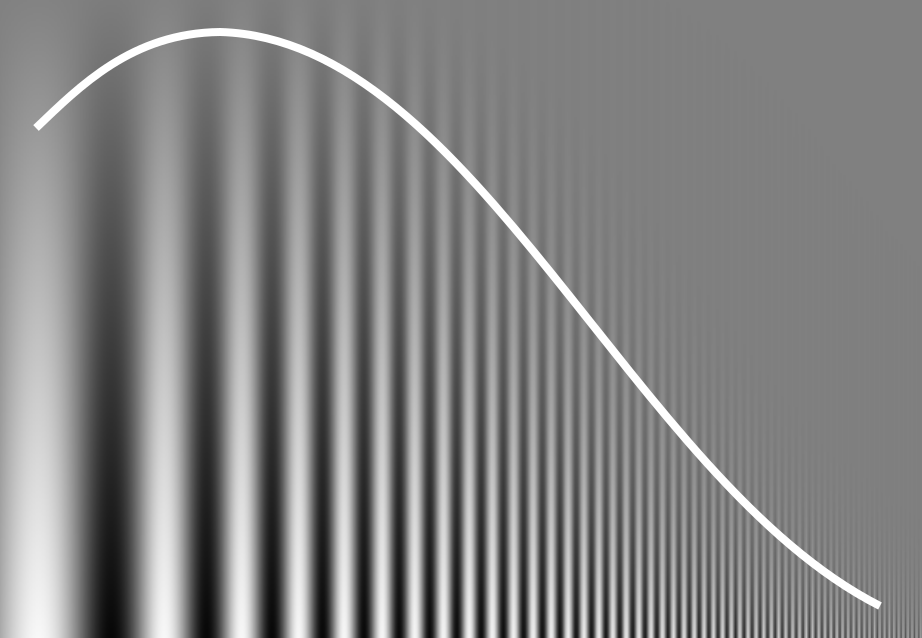
Human perception is tuned to a relatively narrow range of spatial frequencies – a limitation of partly of our neural wiring, but mostly of our vision apparatus. Fine details are perceived as soft and low-contrast. Contrarily, extremely large shapes blend into the background and may get completely overlooked. The sweet spot is somewhere around five to ten cycles per degree of field of view, depending on circumstances, which just about works out to the spatial frequency of body text at a normal reading distance.
This frequency-contrast relationship tells us that:
- at regular sizes, the letterfitting process is mainly guided by the letters’ stems;
- at very large sizes (posters and such), the peak frequency range will be dominated by serifs and other fine details, and therefore the interactions between glyphs will be, too;
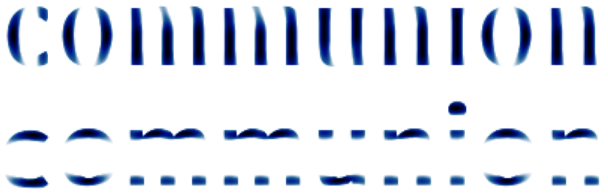
- at very small sizes, entire glyphs (or more) will fall within each peak-response wavelength, so our priority will shift to giving each glyph enough breathing room such that it doesn’t blur together with its neighbour.
This is also why professional designers will print out large hi-res proofs, hang them on the wall, and step a few meters away to judge the fit: it provides the same angle of view as body text when viewed at an arm’s length.
In other words, any set of metrics will work best for text viewed at a particular size.

Punchcutters have intuitively understood this for centuries. Look at some high-quality type families sold in multiple optical sizes, and you fill find that in the display version, letters are kerned tightly based on fine details, whereas in the caption cut, letters are so loosely fitted that barely any kerns are necessary. And even though most digital fonts today only come in one optical size, graphic designers are still taught to fit big headlines manually to account for the scale effect.
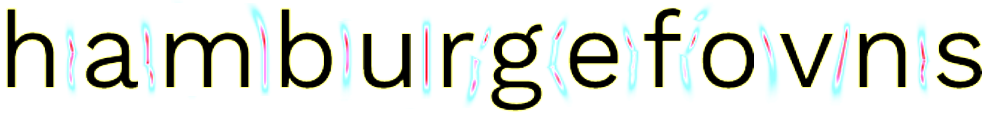
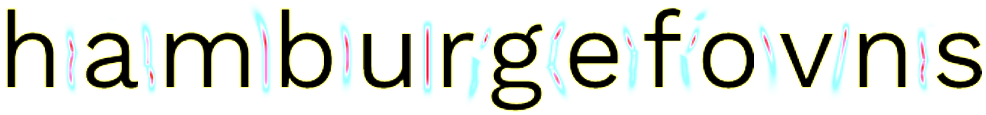
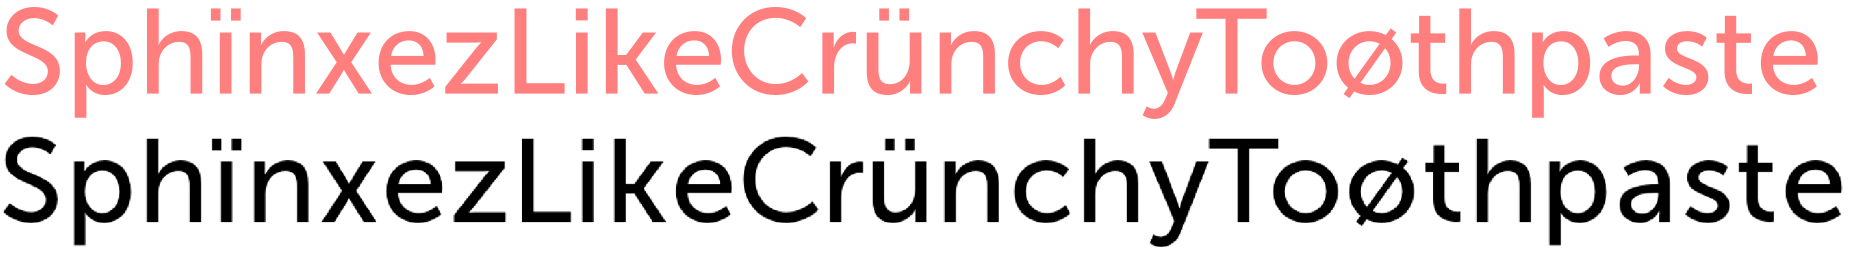
Our first job, then, is to emulate the effects of the contrast sensitivity function by blurring away fine details that don’t contribute to the letterfitting process. If our typeface is meant for very small text, we want to blur each glyph into a smooth, rounded blob. In the body text regime, we want to at least attenuate fine details like serifs and cross-bars. And if our typeface is designed for headlines and posters, we probably don’t want to do anything.
There are various approaches to this, and I have not yet found one that I can universally recommend as the best. Easiest, of course, is a vanilla Gaussian filter, but there are other options. One aspect to consider specifically when choosing a filtering method is the treatment of serifs.
Within the category of “fine details that can be blurred away”, serifs maintain a special position. While other features – bowls, diagonals, crossbars – combine to make up each glyph’s body, serifs are an entirely separate species. In body-size text, they are perceived not as part of each glyph but rather as a fragmented horizontal baseline; at least that is my personal hypothesis, based on the empirical evidence that V1 neurons really have a thing for collinearity. Arguably, serifs serve to increase the acutance of each line of text, although I know of no research confirming that that is actually helpful. In any case, the interaction between two serifs does not affect the perceived distance between two body-size glyphs, so serifs won’t generally figure into body-size letterfitting decisions at all (unless we implement a particular rule by which serifs cannot overlap). Because serif interactions will always dominate, we need to eliminate them as best as we can.
Some basic strategies for the preprocessing stage:
- Oriented filters: For instance, Gaussians with a larger standard deviation along the vertical axis will leave vertical stems unharmed and smoosh away horizontal and diagonal features.
- Band-pass filters: Gabor patch or similar filters can be useful in attenuating or amplifying features of a particular thickness and orientation. However, most band-pass filters (such as the raised cosine-log popular with vision researchers) cause too much ringing, in my experience, to be very useful.
- Masking using the unfiltered glyph: we can multiply the filtered glyph image with the unfiltered glyph image (or its inverse) to eliminate fine details without claiming any nearby negative space.
- Multiplying the entire glyph with a vertical mask to indiscriminately attenuate all features near the baseline and/or x-height. In my experience, this can actually be a reasonable approach.
The above methods can be combined in arbitrary ways, and there are probably more that I have not yet thought of. Perhaps you can even think of reasons why only some methods are plausible, and identify the One True Filtering Approach. An exciting research opportunity!
Electric bubbles: allowing filtered glyphs to interact
Here we finally get to the meat of the framework. In this next step, we will equip each glyph with a kind of force field that allows it to interact with its neighbours. In my code sketches, I’ve been calling this the electric bubble, because it is a conceptual parallel to both electrostatic fields and to the venerable idea of bubble kerning (more on that below).
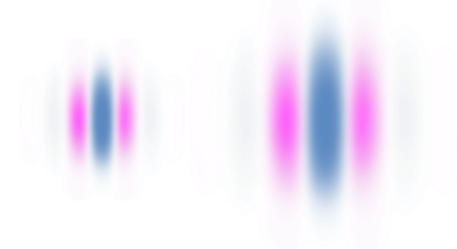
The electric bubble is a potential-like field that represents the perceived proximity to the glyph’s outline. As we place two glyphs at some distance, their electric bubbles will overlap and the sum (or product, up to you) of the two bubbles will represent the strength of the interaction: at locations close to both glyphs, both bubbles are strong, and their interaction will be of appreciable magnitude, too. In locations far away from the glyphs, the interaction will be close to zero.
The electric bubble is computed as follows:
- Exponentiate the filtered glyph, element-wise, by some exponent $k$, e.g. 20.
- Convolve the result with a kernel which is 1 at the center and decays outwards as $(s_x r_x^2 + s_y r_y^2)^{-k/2}$, where $r_x$ and $r_y$ are the horizontal and vertical distance from the center, respectively, and $s_x$ and $s_y$ are parameters that are typically 1 but could differ to introduce some anisotropy.
- Exponentiate the result, element-wise, by $–\frac{1}{k}$.
- Apply some element-wise “force field” function such that the result $d$ decays with increasing distance from the glyph, such as $\frac{1}{d^q}$, with parameter $q$ affecting the rate of decay, or some other decaying function. Lots of choices here, and I don’t know what’s best.
Steps 1 to 3 perform an approximate distance transform on the filtered glyph, and step 4 converts the distance transform to a bubble.
Let’s now place two glyphs at some distance and overlay their bubbles. Naturally, the glyphs’ interaction will grow when we move the glyphs closer together. If the force field function decays nonlinearly, as in the example $\frac{1}{d^q}$, then the rate at which the interaction increases will itself grow the closer the glyphs get, which is likely desirable.
It is probably possible to rigorously argue for the plausibility of certain functions over others on the basis of geometry and empirical evidence. If you have any ideas, I want to know about them!
Attention masking
As mentioned, the two bubbles extend into infinity, at least in theory. And although their interaction is typically strongest in the space between the two glyphs, we will find multiple smaller peaks and ridges in irrelevant locations as well: for instance, inside the glyphs counters. We don’t want to consider those locations in our letterfitting process, so we need to zero them out.
To do so, we must identify the relevant portion of the negative space between the two glyphs. Given that the negative space extends into counters and to infinity above and beyond, this is a judgment call – but one we can make systematically and based on the designers’ parameters. Specifically, here are four important conditions for a location (i.e., a pixel) to be considered “within the relevant portion”:

The distance to both glyphs should be equal.
Locations where the difference in the values of thedistance transforms is small are located exclusively along the equidistant locus separating the two filtered glyphs. I suggest the following expression: $e^{-a\big[\frac{d_1 - d_2}{d_1 + d_2}\big]^2}$. The negative exponential quickly becomes almost-zero where the difference is large. We also normalize the difference by the sum, to make the formula more robust to any upstream factors, and square the result both for symmetry and to penalize large deviations (though one could argue the exponential function already does so). The parameter $a$ can be increased to tighten the set of locations with appreciable magnitude. Other formulations are certainly possible, this one has worked reasonably well for me.

The inner angle between the gradient vectors should be about 180°.
Insome locations, the shortest lines to either glyph are collinear and orthogonal to the glyphs’ outlines, and those locations are naturally of particular interest (“straight interactions”). (Note that direction of the shortest line to a glyph is given by the gradient of the distance field.) On the other hand, the gradient vectors meeting at locations far above or below the two glyphs subtend a very small angle, and are less interesting. To compute this angle at any location, take the distance fields’ gradients (i.e., horizontal and vertical element-wise differences), and use the basic identity $\cos \theta = -\frac{\Delta y_1 \Delta y_2 + \Delta x_1 \Delta x_2}{\sqrt{(\Delta x_1^2 + \Delta y_1^2)(\Delta x_2^2 + \Delta y_2^2) + \epsilon}}$ (the negative sign arises because the right-hand glyph’s gradient field decays to the left). Since we are interested only in locations where $\cos \theta$ is not too far from 1, the sigmoid function is a convenient choice: $1/(1+e^{-b(\cos \theta - 1)})$, where larger values for $b$ will exclude more points with less-than-collinear gradient vectors. The value $\epsilon$ is simply a negligibly small non-zero value than can be added to ensure differentiability even when the term under the square root is zero.
Gradient mean angle.
The angle between the mean of the two gradientvectors and the horizontal can be an important factor as well. Generally, attention is stronger at locations where straight interactions occur at an off-horizontal angle. This is relatively rare and happens in particular where glyphs overlap (think VA, To, etc.). Overlapping glyphs violate the basic rule that each glyph occupies its own space, and they therefore are not usually fitted as tightly as they otherwise might be (except at display sizes). Amplifying the attention mask at these locations ensures that lower-magnitude interactions suffice there, leading to a looser fit. A convenient formula, using the gradient components already computed, is $\sin \gamma = \frac{|\Delta y_1 - \Delta y_2|}{\sqrt{(\Delta x_1 - \Delta x_2)^2 + (\Delta y_1 - \Delta y_2)^2 + \epsilon}}$. To incorporate this into the attention function, we might use a simple linear function like $1 + c\sin \gamma$, where larger $c$ would result in a looser fit between overlapping diagonals.
Vertical coordinate.
Finally, each location's absolute verticalcoordinate can be used to apply some arbitrary weighting function. For instance, we might use this choose to emphasize interactions happening at x-height, or to de-emphasize interactions happening near the baseline (to effectively exclude serifs from the process).
The four factors above can be multiplied to obtain a good estimate of the relevant area between the glyphs. The uninspired-sounding term “area of attention” is borrowed from the machine learning world, where very similar attention-masking techniques are used widely.
More about electric bubbles
The electric bubble approach evolved from many other ideas I have tried and discarded over the years, but its validity isn’t exactly self-evident, so please allow me to start a bit further afield to launch into a (gratuitously handwavy) attempt to justify it.
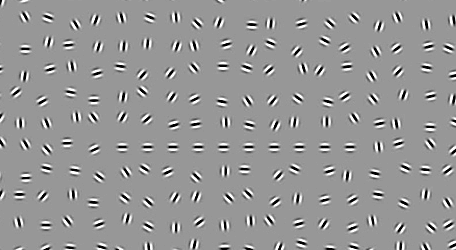
The most (the only?) fruitful way to think about letterfitting, in my opinion, is to consider it an exercise in minimizing the saliency of irrelevant features in the context of neural pattern suppression mechanisms. Those inhibitory connections, hardwired into our visual cortex, reduce the saliency of patterns (like the grass around us) to help our attention lock onto deviations from those patterns (like the approaching lion).
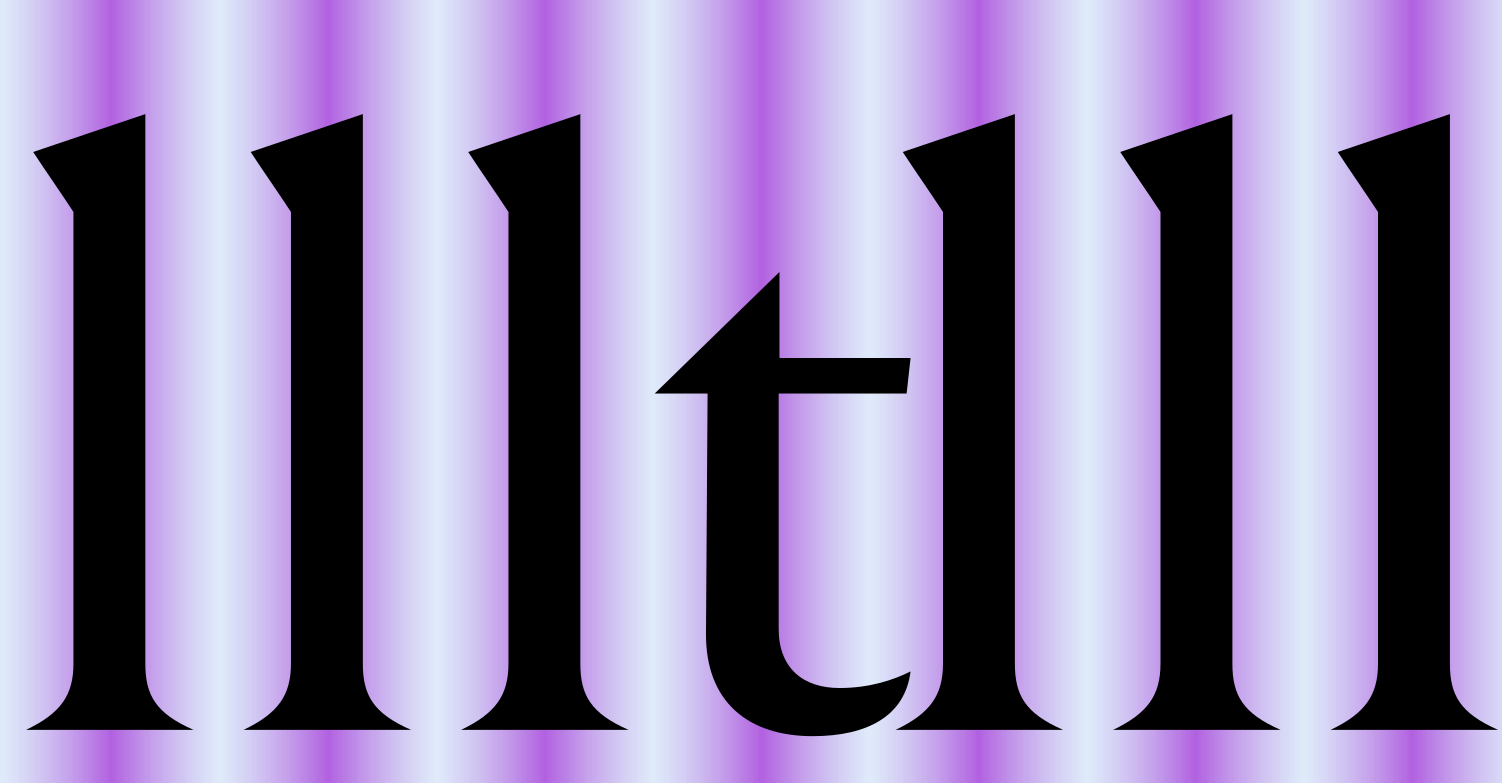
For instance, when you see a picket-fence pattern of vertical lines, you don’t really notice any individual lines, but rather just perceive the pattern as a whole (unless you make a conscious effort to focus on one particular line’s shape). Because the conforming lines are suppressed, any clumps or holes or miniscule rotations pop out immediately.

This has been studied extensively, and good models exist for how this might be implemented in our wetware.
We might then connect this observation to the fact that the letters of our alphabet consist of some unique feature – an arch, a horizontal crossbar, etc. – mounted on a vertical stem or two. Therefore, by fitting (text-size!) letters such that the texture formed by vertical stems falls within a narrow frequency band, we allow the letters’ features to be maximally salient.
In fairness, aligning all letters’ stems exactly on a picket-fence doesn’t yield very pleasing results, either. That is because for some letters, the ability to insert a small, noticeable shift into the stem pattern is a salient feature (or, to look at it differently, because the exact alignment would create unacceptably strong interactions between horizontal features, like crossbars, and neighbouring glyphs). For instance, letters like L or V rely on a bit of whitespace around them, which is why they typically aren’t fitted as tightly as we otherwise might.
From this viewpoint, glyphs sitting too close or too far are problematic not because they violate some ineffable, divine “balance”, but simply because they produce false-positive saliency. Too close, and separate stems fuse into as a single, fat stem of roughly half the spatial frequency of the rest of the pattern. (Interesting tidbit: letter crowding has been suggested as one of the causes underlying dyslexia, and there is research saying that more inter-letter space helps kids and dyslexics read faster). Too much space, on the other hand, and we are creating another type of salient deviation, namely one that unexpectedly signals to higher-level processes “word break here!”, which conflicts with the brain’s language model and thus interrupts the reading flow. Note that tracking out all glyph pairs is acceptable (within reason), because it does not affect the spatial frequency bandwidth.
Bowls (e.g. b, d) and diagonals or arms (e.g. r, v) have their own negative space above and/or below and are therefore at a lower risk of fusing into a salient blob when they are too close together, compared to vertical stems. Conversely, their extra space makes them more vulnerable to salient excessive separation.
This gives us a clue about what a robust letterfitting model needs to do: given any pair of glyphs, it must take into account the shape of the adjacent sides for locations where excessive proximity or separation could create spatial frequencies that fall too far outside the suppressed band. In some cases, the risk is high, such as with two parallel shapes (nn, VA, etc.). In others, the risk is low, such as with concave or convex shapes (oo, cz, etc.). In others yet, it is somewhere in between (bx, sa). Importantly, however, the relationships involved are likely not linear, and they are likely dependent on orientation. So far, so obvious! We thus need a way to assess the inter-glyph distance landscape at different scales and orientations.
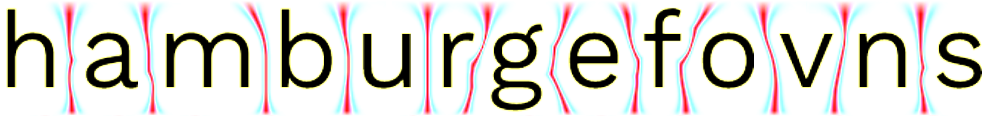
It is well known that the cells in our primary visual cortex do this by responding to very simple patterns. One particular pattern is relevant to us here: dark line, bright line, dark line – because it responds to letter stem, negative space, letter stem. Such patterns can be represented using a variety of mathematical functions, the most popular of which is the so-called Gabor filter (a.k.a. Gabor patch or Gabor kernel), a two-dimensional Gaussian modulating a sinusoid. Dark-bright-dark transitions of a particular size and orientation will elicit particularly strong responses in cells tuned to detect this size and orientation, even if the match isn’t perfect. This makes Gabor filters a simple and very robust tool to measure distances and orientations between neighbouring irregular shapes, and although it would certainly be a gross oversimplification to claim that the manual letterfitting process is dictated entirely by V1 simple cells, Gabor filters are nevertheless an obvious first choice.
We can simulate low-level perception by sweeping computer-generated Gabor filters of various sizes and orientations across our glyph pair image and recording the responses. Strong responses from large filters at a particular location, for example, suggest that the glyphs are far apart there. Other locations might see strong responses from smaller filters, or from rotated filters (e.g. between diagonals). The complete image provides an accurate picture of the distance-and-orientation landscape between the glyphs that can guide our letterfitting decisions.
However, all of this is much easier said than done:
- Convolution is computationally expensive and therefore quite slow. Convolving each pair with a multitude of filters at every distance would hamstring an interactive, iterative design process.
- Convolution covers the whole image, not just the space between the two glyphs, but also the space above, below, and in counters. Without a way to identify the relevant area of attention, we cannot use the measured interactions to infer the perceived distance.
- Because convolution is a simple integration over area, thin stems are nearly ignored compared to the response elicited by thick features. However, there is little evidence that thin stems are afforded (much) less surrounding negative space in high contrast typefaces. The distance from the outline is much more important than the thickness of the line.
To sidestep these problems, we must find an alternative way of obtaining, at every point, the shortest line to each glyph, its length, and its angle. The obvious solution is to compute the Euclidean distance transform around each glyph. The standard EDT, however, is impractical here: it neither accepts the grayscale input obtained from our preprocessing step, nor is it differentiable, so we cannot use it for parameter estimation on existing fonts.
Differentiable alternatives to the EDT are scarce. Two researchers from Florida came up with the following trick: convolve the input image with a large kernel that is 1 in the center and decays exponentially outwards, then take the logarithm of the result. This works great, except that for good results, the decay has to be really fast, leading to floating point underflows not far from the glyph. As an alternative, I decided to instead use polynomial decay, and take a root instead of a logarithm. While not quite as accurate far away from the glyph, this modification largely solves the underflow problem. This might remind you of the sum potential field created by a set of point charges, which also decays polynomially – the reason for the working name “electric bubble” (picture each pixel holding a charge equal to its greyscale value taken to the power $k$). A higher exponent $k$ leads to more accurate results; however, at values above about 20, numerical underflows appear close enough to the glyph to mess up the attention computation.
The idea of equipping glyphs with bubbles is over 20 years old., and was recently re-introduced as a Glyphs plugin. The model I propose here generalizes the original binary-valued bubbles to continuous-valued bubbles, and it explains the significance of the locus where two bubbles meet as the same locus where the most responsive Gabor filters would be centered, providing an avenue for automatic bubble generation based on relatively few parameters.
We now have all of the ingredients to replace the Gabor filters – and, what’s more, we can pre-compute each glyph’s bubble to save us some time.
The attention mask plays a critical role:
- By multiplying it with the interaction field, we can limit the interaction to locations between the glyphs where corresponding Gabor patches would respond strongly. For example, Gabor patches would not respond (much) above and below the glyphs; here, the attenuation based on the angle between gradient vectors accomplishes the same thing.
- It is a fuzzy mask, and its shape can be controlled by the designer.
- Since it is based only on glyph size and not on interaction strength, it offers a convenient denominator for divisive normalization across all glyph pairs.
Although this “theory”, if it rises to that title, has more rigour than most claims made about letterfitting, and although I am confident that it isn’t entirely too far from the truth, it should still be taken with several grains of salt. If you are knowledgeable about human vision, please do get in touch and tell me what I am wrong about – I don’t want to be a source of misinformation.
Current status
This brings us to today: what can this model do?
The best way to test the usefulness of this model is to find parameters that would result in a good approximation of the metrics of an existing font. Unfortunately, this is not directly possible at the moment. What we can do is tweak the parameters (via gradient descent) until the attention-normalized interaction equals some constant for glyph pairs rendered at their original distance. If the theory underlying the model holds, this should be possible to do – within a few percentage points, since the original metrics are unlikely to be perfect.
Unfortunately, this creates a difficult tradeoff: using a few global parameters only leads to decent, but not perfect results. Adding more parameters, however, will cause overfitting. In our model, overfitting visibly manifests as completely implausible attention areas and typically results in normalized interaction values that stay very close to the desired constant regardless of the distance. In other words, adding more parameters gives the illusion of a fantastic parameter fit, but makes it impossible to actually infer the right distance.
This does not mean, however, that it is impossible to generate good metrics, if only one is willing to try reasonable parameters by hand. What’s missing at this point is a software tool to allow such users to go through such an iterative design process.
At the moment, I don’t have the time to build such a tool, but I would be thrilled if someone else (you, dear reader?) had any interest in doing so. If you are interested in hacking on this, please let me know.
A big mess of experimental code is available as a Google Colab Notebook; I also started building a pre-alpha browser-based tool, mostly because I wanted to try out opentype.js and tensorflow.js. Both are broken in all sorts of ways and don’t do much, but perhaps they contain some code useful to you if you want to build something similar.